Out of the car for inspection Before starting the train, the driver's physical condition will be checked to ensure driving safety
Real-time tracking and time recording Tracking and monitoring the driver's driving behavior throughout the whole process to protect the driver and make him/her compliance, and can provide a time record for inspection
Risky behavior log By recording data such as vehicle distance detection, lane departure and front collision, drivers can be warned of dangerous events
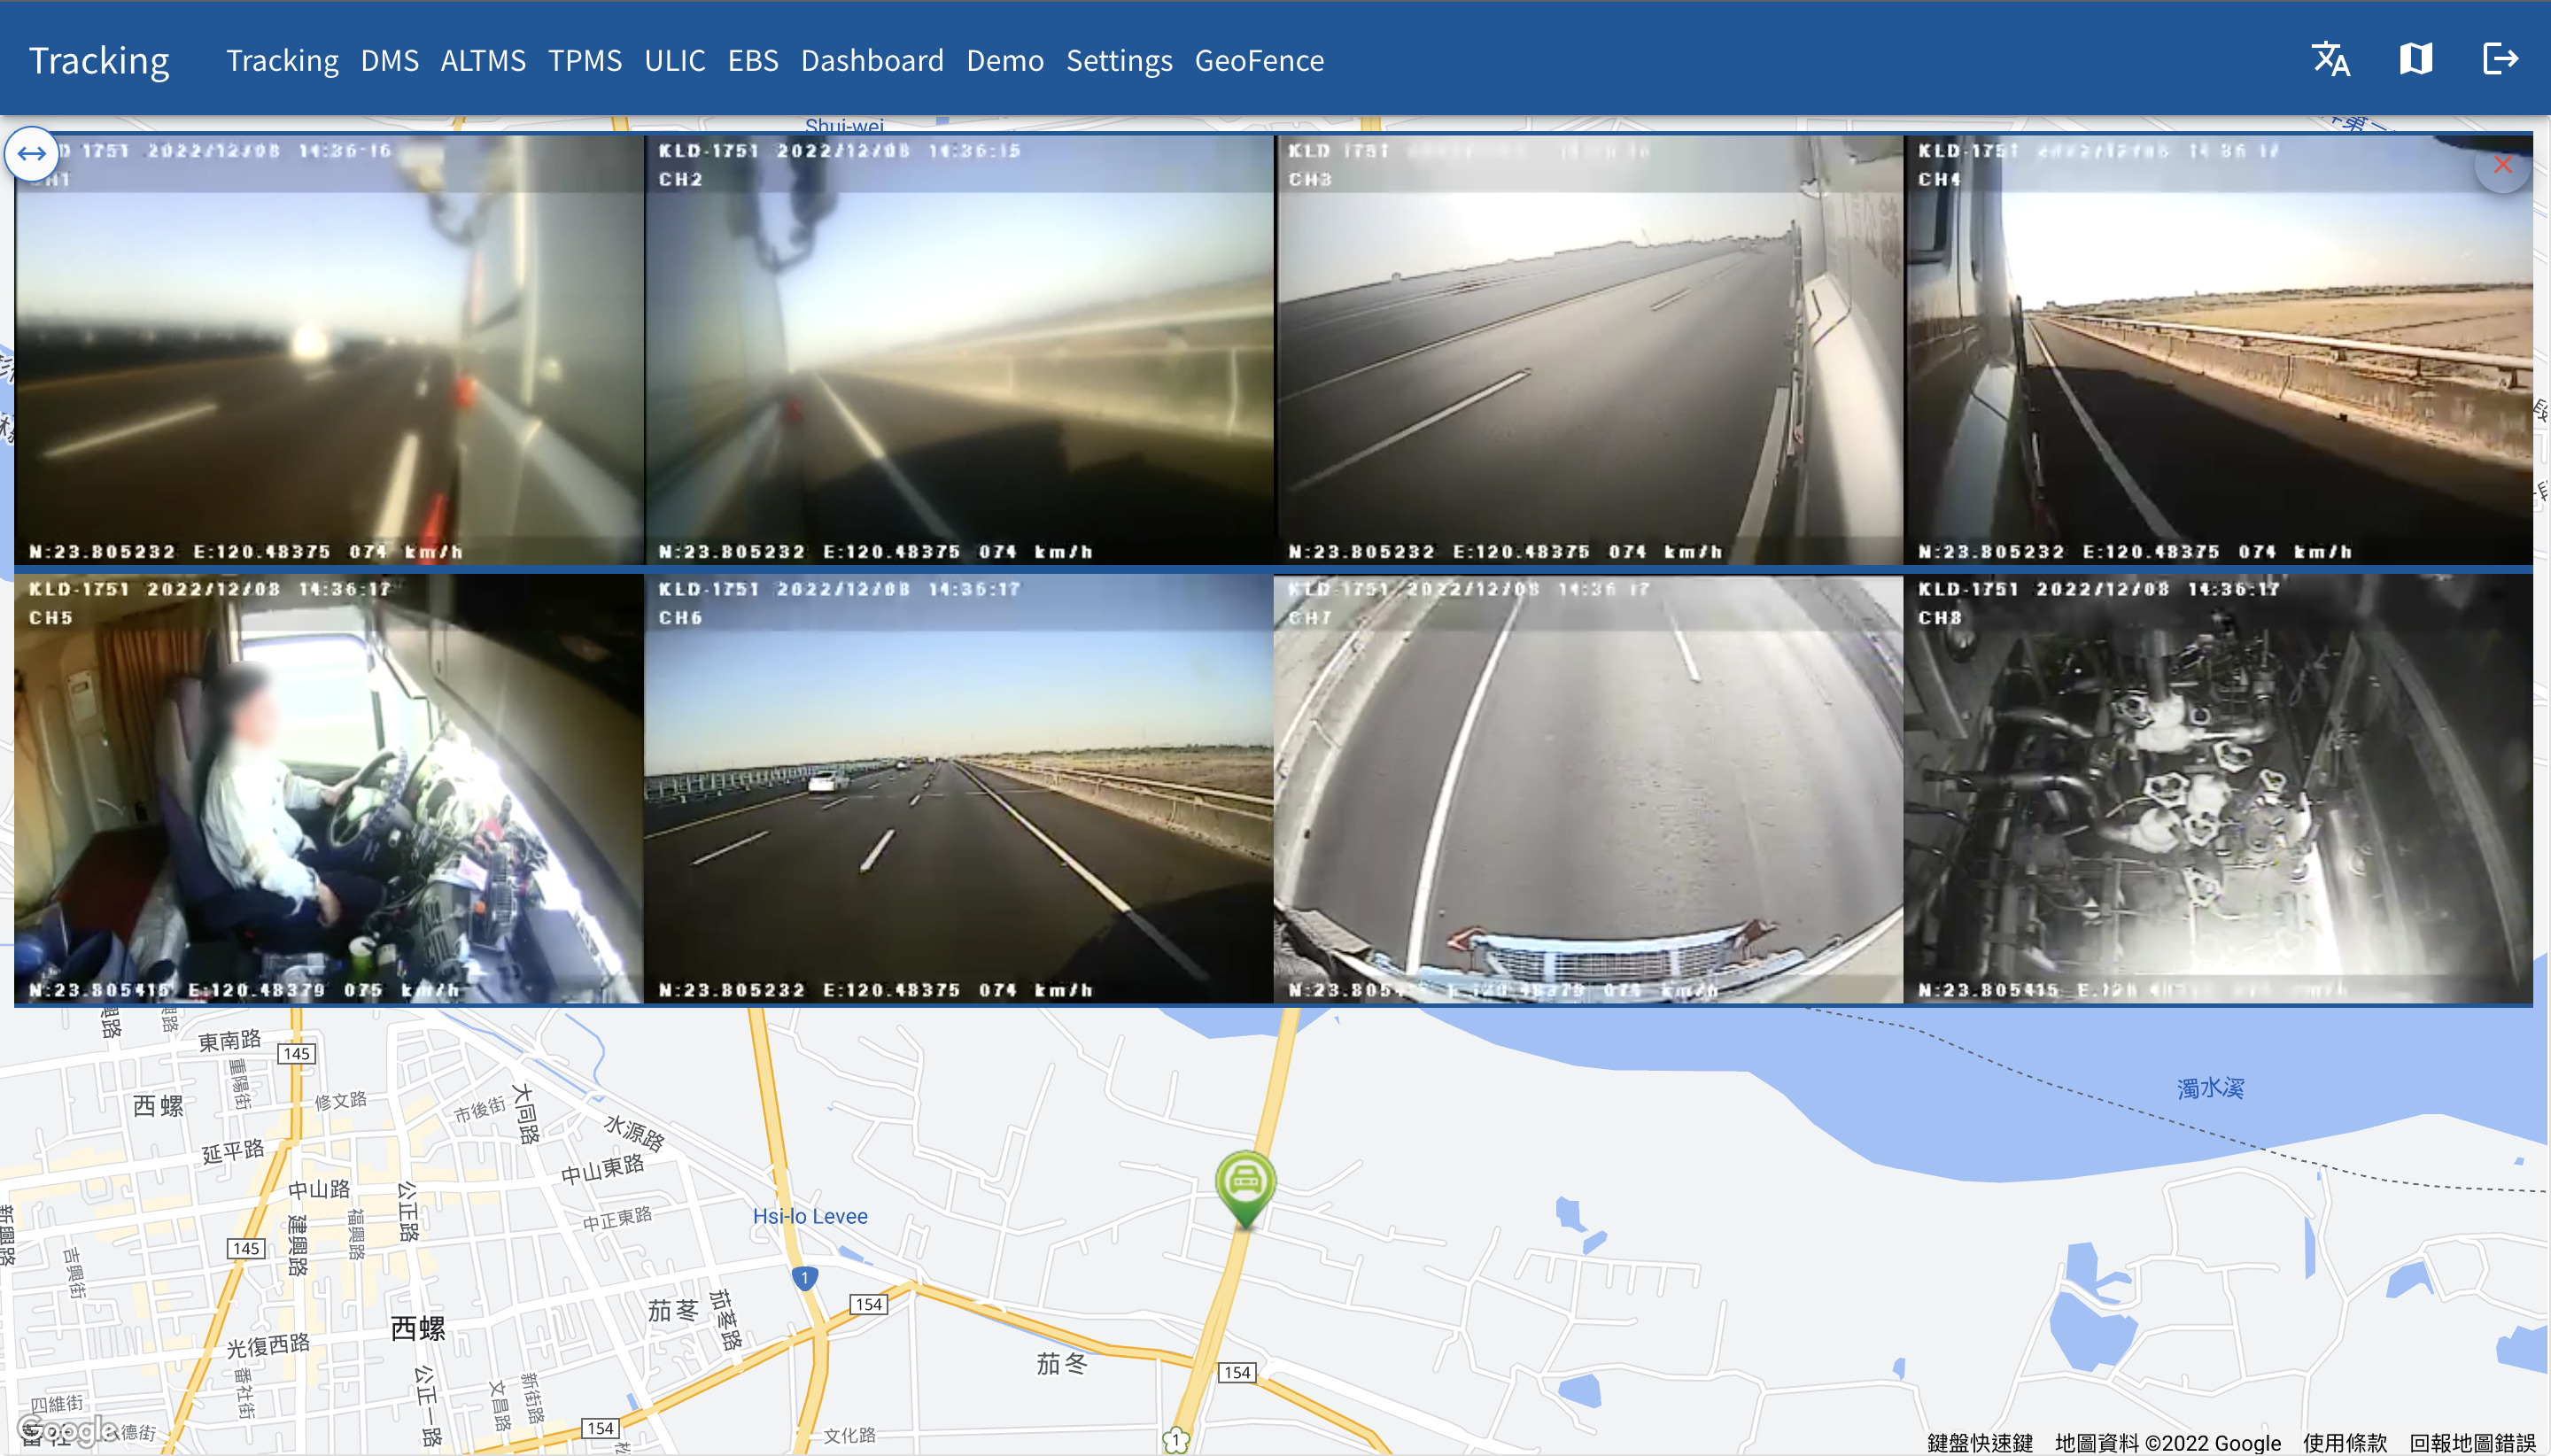
Video Streaming
Protect your business with a camera(Forward direction monitoring Record road view and analyze the road ahead
Driver monitoring Record the driver and cabin areas, monitor Distracted driving and provide monitor policy violations, such as improper use of seat belts or cell phones to protect drivers and bring them into compliance.
Side monitoring Record side view of vehicle, record the options on the left and/or right side of the vehicle and catch hard-to-see sideslip events.
Rear monitoring Record the rear view of the truck or trailer and capture backup and rear-end collisions.
Internal monitoring Records in the vehicle or trailer, capture load/unload procedures, damage, disputes, and thefts as video evidence.
AI Fleet dashcams can reduce collisions Integrate all data points and definition of hazardous events, record 15 seconds of video, OTA enabled event updates, collision mitigation through real-time in-cockpit alerts that warn drivers of impending accident.
SafeDrivR®
Be aware of driver safety trends The Safety Dashboard report provides a quick overview of your fleet's management of drivers' most dangerous driving states and overall safety scores. Reports on key fleet metrics such as speed, harsh braking, backup, seat belt use etc.
Configure the security alert service With Carota, you can customize fleet rules and be notified by email or text message when violations occur. Be informed of all possible collisions and take timely action to avoid risks.
Assisted Driver Assistance System ADAS can help your driver identify and avoid risks before they are involved in a collision. Ask Carota for a solution.
Driver Safety Reporting
DMS monitors driving conditions in real time It is designed to detect sleep, drowsiness, cell phone usage, smoking and general inattention while driving and keeps records in each driver's scoring profile.
The dashboard records data The system displays the dashboard of drivers, including driving time, mileages, number of events recorded given a period of time, etc.
Evaluate the performance of the driver You can spot poor on-road habits of certain driver, and compare behavior scores of each driver and use the data as a tool for driver training and development.
Driving style analysis It can be used to encourage safe, economical driving. This is a more accurate indicator of unsafe driving than simply monitoring compliance with speed limits.
Fleet Reports
Provide fleet scoring data The system displays the dashboard of fleets based on the data you need to make decisions and it shows the rating score of each fleet you own.
Create a custom report to read data You can create custom reports and export them into CSV files. It builds-in filter tool by period, fleet, driver, and vehicle.
Analyze the entire fleet data You can analyze trends across your fleet, or for a particular vehicle, based on miles driven data, fuel economy, and maintenance.
Improves fleet visibility Uses AI to turn real-time data into business intelligence by spotting opportunities as well as improvement areas.
Fleet Benchmarking
The dashboard displays fleet data Serving the basis of comparison among fleets, and pinpoints potential problems such as productivity and utilization.
Daily report Provides daily summaries of trips so you can get a quick overview of vehicle usage.
KPI data reading analysis It graphically depicts data such as distance driven per day, fleet averages, trip comparisons, total time on the road, mileage overview, etc. and summarizes KPIs, such as number of trips, mileages, and standstill time.